Appendicitis: Controversies in clinical evaluation and CT imaging
Appendicitis: Controversies in clinical evaluation and CT imaging
Author: Michael C. Plewa, MD, FAAEM, FACEP, Research Director, St. Vincent Mercy Medical Center, Emergency Medicine Residency; Toledo, Ohio
Peer Reviewer: Andrew D. Perron, MD, FACEP, FACSM, Associate Professor & Residency Program Director, Maine Medical Center, Portland, Maine
Introduction
Much has changed recently in the diagnosis of appendicitis, with a dramatic increase in the use of imaging modalities. Over the past decade the use of computerized tomography (CT) has outpaced that of ultrasound (US), and now is used nearly routinely because of its excellent sensitivity and specificity. Yet concern over cost, delay, radiation exposure, and potential risk of future cancers (especially in children) has led to concern about its overuse. Additionally, there remains debate as to whether contrast is necessary, how to interpret equivocal CT scans (e.g., the nonvisualized appendix), and which population of patients benefits most from CT imaging.
Perhaps much also has stayed the same, especially the persistent concern over delayed diagnosis, missed appendicitis and negative appendectomy rates, the diagnostic challenges in children and atypical presentations.
What clinical findings are useful?
Source: Andersson RE. Meta-analysis of the clinical and laboratory diagnosis of appendicitis. Br J Surg 2004; 91:28-37.
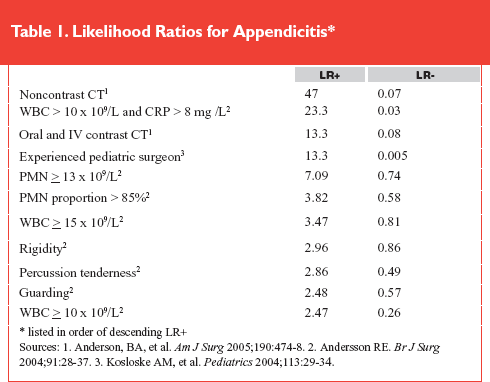
Dr. Andersson, of County Hospital Rhyhov, Sweden, performed an extensive meta-analysis of 24 studies comparing various clinical and laboratory results in 5833 patients of all ages admitted to the hospital with possible appendicitis, where the overall prevalence of appendicitis was 41% (27%-61%). The diagnostic value of individual variables was expressed in terms of discriminatory power, the area underneath the receiver-operator characteristic (ROC) curve (AUC), and predictive power, as positive or negative likelihood ratios. Discriminatory power varies from useless, with AUC of 0.5, to perfect, with AUC of 1.0. Positive likelihood ratios (LR+), the ratio of sensitivity to 1 – specificity, and negative likelihood ratios (LR-), the ratio of 1– sensitivity to specificity, are useful to transform pretest odds to post-test odds of disease, or by using the Fagan nomogram to transform from pretest probability to post-test probability. Larger LR+s, and smaller LR-s, have the greatest effect on the likelihood of disease. For example, LR+ values of 2 - 5, 5 - 10, and more than 10, and LR- of 0.2 - 0.5, 0.1 - 0.2, and less than 0.1 have small, moderate, and large, respectively, influence on the likelihood of disease.
Variables with the greatest discriminatory power were neutrophil (PMN) count (0.78), total white blood count (WBC)(0.77), and C-reactive protein (CRP) level (0.75), followed by rebound (0.70), percussion tenderness (0.70), guarding (0.68), and migration of pain (0.68). Rectal tenderness, as many would have predicted, had no discriminatory power (0.51). Individually, the most useful positive predictive examination findings were rigidity (LR+ 2.96), percussion tenderness (LR+ 2.86), and guarding (LR+ 2.48), although each of these had LR+ < 4 (small utility). The most useful inflammatory markers were PMN count 13 x 109/L (LR+ 7.09) or greater, PMN proportion greater than 85% (LR+ 3.82) and WBC 15 x 109/L (LR+ 3.47) or greater, and PMN count 9 x 10⁹/L (LR+ 2.66) or greater. Individually, the most useful negative predictive variables were PMN proportion less than 75% (LR- 0.24), lack of localized tenderness (LR- 0.25), and WBC less than 10 x 109/L (LR- 0.26). No variable had LR- less than 0.20, individually. When several of these variables were included together, however, the predictive power improved dramatically. For example, if guarding or rebound and WBC count of 10 x 109/L or greater were each present, the LR+ was 11.34 and if each was absent, the LR- was 0.14. Together, the combination of a WBC greater than 10 x 109/L and CRP greater than 8 had the greatest predictive power, with LR+ of 23.3 and LR- of 0.03. With a WBC greater than 10 x 109/L, proportion of PMN greater than 70%, and CRP greater than 12 demonstrated an LR+ 20.85 and LR- of 0.03.
Commentary
This meta-analysis reinforces the importance of clinical findings such as rigidity, rebound, guarding, and percussion tenderness as well as migration of pain, but also dispels several myths regarding inflammatory markers in the appendicitis workup. Traditionally, the WBC count is considered to have inadequate sensitivity to exclude appendicitis, and some reviews suggest that obtaining a WBC count is unnecessary in the evaluation of a patient with suspected appendicitis, because of its poor predictive ability. For example, in a recent prospective study of 293 patients with possible appendicitis, researchers found a WBC > 10,000 cells/mm3 had a 76% sensitivity and 52% specificity for appendicitis.1 Contrary to common belief, this meta-analysis demonstrated the WBC count, PMN count, PMN ratio, and C-reactive protein to be useful tests in the diagnosis of appendicitis; they have greater predictive value than historical or physical examination findings. When two or more of these laboratory findings are positive, the likelihood of appendicitis is high, and when two or more of these are negative, the likelihood of appendicitis is very low.
This article is an excellent source of LRs for various clinical and laboratory findings in appendicitis. Suppose one were to evaluate a patient with possible appendicitis, begin by estimating the pre-test probability at 40%, and find that the patient had a WBC less than 10 x 109/L, a proportion of PMN less than 70%, and a CRP less than 12, then using the LR- of 0.03, the post-test probability of appendicitis has decreased to 2%. This calculation can be done on various computer software programs or by using the Fagan nomogram (http://www.childrens-mercy.org/stats/definitions/fagan.htm).
Does the risk of appendiceal rupture vary over time?
Source: Bickell NA, et al. How time affects the risk of rupture in appendicitis. J Am Coll Surg 2006; 202:401-406.
We have often heard that delay in diagnosis can lead to perforation of the appendix, and with this a prolonged or more complicated course. This article is the first to attempt to quantify this risk of appendiceal rupture over time. The authors retrospectively reviewed the office, clinic, emergency department (ED), and hospital records for a random sample of 219 of 731 appendicitis cases operated on in a two-year period at two teaching hospitals. The overall rate of perforation was 16% and is similar to the 13% rate reported by the 2000 National Hospital Discharge Survey of 255,000 cases of appendicitis. As expected, rupture rates were higher in those patients younger than 6 years (60%) and those older than 65 years (58%). The best predictor of appendiceal rupture was untreated symptoms beyond 36 hours (relative risk [RR] 6.6), followed by age 65 years or older (RR 4.2), fever greater than 38.9°C (RR 3.6), and heart rate 100 beats/min or higher (RR 3.4).
The risk of perforation in the first 12 and 24 hours was very low (0% and 0.6%), and when patients presented within 36 hours of untreated symptoms, the risk of rupture was 2% or less. Beyond 36 hours of untreated symptoms, the risk of subsequent rupture increased approximately 5% for each 12-hour period. For patients with symptoms of less than 4 days duration, prior to surgery, 14 of 187 (7.4%) had rupture, in comparison to 22 of 32 (69%) patients with symptom durations of greater than 4 days.
The average (median) patient-related time was higher in the ruptured appendicitis group (57.2 hours) versus the nonruptured group (24 hours), as was the system-related time (17.4 hours vs 7.9 hours, respectively), with approximately three-fourths of the delay to surgery in both groups related to late patient presentation. Factors associated with prolonged system time delays were those cases without appendicitis as the leading diagnosis, without a classic presentation, without right lower quadrant tenderness, initially evaluated outside of the hospital instead of the ED, and those undergoing imaging. Patients undergoing CT scan or ultrasound imaging had average system-time to treatment of 18.6 hours and 13.5 hours, respectively, in comparison to those without imaging of 7.1 hours and 7.2 hours, although no increase in the rate of rupture was reported.
Commentary
The importance of this article for acute care physicians is that patients who present within 36 hours of symptom onset with possible appendicitis can be evaluated in a routine fashion without elevated risk of rupture. Although appendectomy is not considered an "emergent" surgical procedure, patients with possible appendicitis who present close to or beyond 36 hours of symptom onset should be evaluated more urgently. Emergency physicians should consult a surgeon early in the evaluation of possible appendicitis, and recommend repeat evaluation of those with equivocal clinical or radiographic findings within "hours" rather than "the next day."
Is oral contrast needed?
Source: Anderson BA, et al. A systematic review of whether oral contrast is necessary for the computed tomography diagnosis of appendicitis in adults. Am J Surg 2005;190:474-478.
In a systematic review of 23 reports (published from 1993 to 2003) of CT imaging in adults older than 16 years with possible appendicitis, the authors from the University of Washington produced aggregated diagnostic performance characteristics for CT scan using rectal, oral, rectal and oral, oral and intravenous (IV), and noncontrast techniques. There were 3474 subjects represented in the 5 retrospective and 18 prospective studies. Noncontrast CT had similar sensitivity (93%) as oral and IV contrast (93%), higher than oral contrast (83%), and yet lower than rectal contrast (97%) technique. Noncontrast CT had similar specificity (98%) as rectal contrast (97%) and higher than oral (95%) or oral and IV contrast (93%). Overall accuracy with noncontrast CT (96%) was similar to rectal contrast CT (97%) and greater than oral (92%) or oral and IV contrast (92%) techniques. There are several limitations to this study, including the lack of prospective trials directly comparing contrast and noncontrast techniques, the heterogeneity of designs, the various inclusion and exclusion criteria, imaging technique and criteria for positive interpretation, and inclusion of older studies (the great majority of studies used helical scanners; 85% in noncontrast and 82% in oral contrast studies).
Commentary
Of the various possible CT scan methods, the administration of oral contrast is the most time-consuming, requiring typically 1 to 2 hours from contrast administration to scan time to allow opacification of the cecum. This delay may not only be a nuisance for the patient and family members, and potentially delay surgery; it also slows the flow of patients in the ED. Additionally, oral contrast may be tolerated poorly by the symptomatic patient. Despite this fact, oral and IV contrast CT imaging remains the most commonly used imaging technique for appendicitis in the United States This study provides evidence that this practice may be outdated, and that noncontrast CT may be as or even more accurate than contrast studies.
The authors also raise several interesting points for consideration. First, there is debate as to whether CT imaging has decreased the rates of negative appendectomy or perforation. And second, that CT imaging may not be as accurate in everyday clinical settings as in published results from research institutions. For example, researchers reviewed health maintenance organization records of 4058 patients undergoing appendectomy in community hospitals in the Group Health Cooperative of Puget Sound from 1980 to 1999, and found the negative appendectomy rate was unchanged following the introduction of CT scan.2 The sensitivity of CT in their setting was lower, 88.3%, than the 94% sensitivity published in a systematic review by Terasawa.3 We must also be cautious that the preliminary CT reading, which guides clinical decision-making, may not be as accurate as the final reading. Maluccio and colleagues found a lower sensitivity of CT for appendicitis among radiology trainees, where the preliminary radiology interpretation (by a radiology resident or fellow along with surgical staff) of abdominal CT for appendicitis did not correlate with operative management, whereas the final CT interpretation did correlate with appendicitis pathology.4
Equivocal CT findings
Source: Daly CP, et al. Incidence of acute appendicitis in patients with equivocal CT findings. AJR 2005, 184:1813-1820.
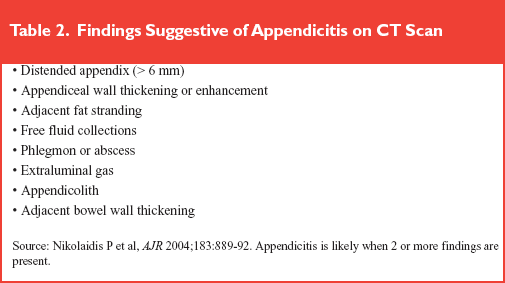
The authors performed a 5-year retrospective radiology information system database review identifying 172 CT scans (predominantly oral and IV contrast) with equivocal readings (12.8% of 1344 adult patients with possible appendicitis from January 1998 - December 2002). The rate of appendicitis in this group was 31% (53/172). The films were viewed by 2 experienced radiologists, blinded to original readings and final outcomes. Surprisingly, they had only fair to moderate agreement (kappa scores between 0.27 - 0.57). For example, reviewers disagreed 20% of the time as to whether the appendix could be identified, 30% on fat stranding, 31% on free fluid, and 13% on presence of an appendicolith. In this study, an equivocal reading was defined as not positive, not negative, but for which appendicitis was included in the differential (including "possible appendicitis"), and commonly included any of the following isolated findings: appendiceal widening larger than 6 mm, appendiceal wall thickening, nonvisualized appendix, fat stranding, free or loculated fluid, or appendicolith.
In contrast to a dramatic increase in the number of scans from 1998 - 2002, there was a steady decline in the percentage of equivocal scan interpretations from 23% in 1998 to 9.5% in 2002. Overall, 31% of cases with an equivocal CT reading had appendicitis, compared with 0.2% of those with a negative reading. When appendiceal enlargement was an isolated finding, the incidence of appendicitis increased from 13% to 14% with diameter less than 9 mm to 50% to 52% with diameter 9 mm or larger. When fat stranding or fluid were present and the appendiceal diameter was less than 6 mm, 17%-27% had appendicitis, yet when the appendix could not be identified, 37 %-53% had appendicitis. In scans without fat stranding or fluid and inability to visualize the appendix (i.e., truly indeterminate scan), the prevalence of appendicitis was 14%-17%.
Commentary
When reviewing publications on CT scan for appendicitis, one must be aware that some authors include equivocal results as positives (lowering specificity and positive predictive value), others include equivocal results as negatives (lowering sensitivity and negative predictive value), and still others exclude equivocal results from their calculations of sensitivity, specificity, and accuracy. This is one of the first studies to address the issue of the risk of appendicitis when the CT scan reading is equivocal.
The 30% incidence of appendicitis in equivocal CT scan readings in this study is surprisingly high. Interpreting an equivocal CT reading in your institution will depend on the experience of your CT radiologists as well as the prevalence of appendicitis in those undergoing imaging (24% in this study). The bottom line, however, is remembering that an equivocal CT is not negative.
This study is another reminder that appendiceal diameter is a sensitive but nonspecific finding in appendicitis, and that the prevalence of appendicitis increases with increased diameter.
The nonvisualized appendix
Source: Nikolaidis P, et al. The nonvisualized appendix: Incidence of acute appendicitis when secondary inflammatory changes are absent. AJR 2004,183:889-892.
In a 33-month retrospective review from January 1999 to September 2001 of 366 abdominal CT scans with oral and IV technique from consecutive systematically sampled patients of all ages with possible appendicitis, the appendix was not visualized by both the initial radiologist and study radiologist in 46 or 13% of cases. These cases also had no other findings of appendicitis, such as fat stranding, appendicolith, phlegmon or abscess, extraluminal gas, or fluid collection. There was a single case of missed appendicitis when the appendix was not visualized and no other appendicitis signs were present, for an incidence of 2% (95% CI, 0%- 11%).
Commentary
Emergency physicians and surgeons evaluating a patient at intermediate risk for appendicitis must decide how to interpret an indeterminate CT scan reading in which the appendix is not visualized and there are no secondary inflammatory changes. This important clinical scenario, unfortunately, is not uncommon, and this study would suggest it occurs in as many as 13% of CT scans. This study suggests that the incidence of appendicitis in this setting is much lower (2%) than the previous study by Daly and colleagues in which a nonvisualized appendix in the absence of fat stranding or fluid had a 14%-17% incidence of appendicitis. The authors of this study do not state the prevalence of appendicitis in the 366 scans. Until larger studies are published, we must assume that the incidence of appendicitis in the setting of nonvisualized appendix without inflammatory changes is somewhere between 2% and 17%.
Ultrasound or CT?
Source: Garcia Peña BM, et al. Selective imaging strategies for the diagnosis of appendicitis in children. Pediatrics 2004;113:24-28.
Strategies to decrease the use of CT scan in appendicitis are important, especially in children, to minimize exposure to ionizing radiation (and subsequent risk of malignancy, which may be as high as 1 in 500), as well as to minimize cost, time delay, and discomfort.
Researchers used recursive partitioning in a retrospective cohort of 1401 children with equivocal appendicitis admitted to Children's Hospital Boston from January 1996 to December 1999 to identify low-, medium-, and high-risk groups. The low-risk group is defined by PMNs < 67%, bands < 5%, and no guarding, whereas the high-risk group is defined by WBC > 10 x 109/L, PMNs > 67%, pain greater than 13 hours, and guarding. The appendicitis rates were 10.5% for the low-risk group, 62.9% for medium, and 90% for the high-risk groups. These three risk groups were then used to compare three guidelines.
- The first (the standard clinical practice strategy at Children's Hospital Boston) was to perform an ultrasound on all patients initially, regardless of risk, then operate if US findings were positive and perform CT if US findings were negative. A positive CT finding led to an operation, and a negative CT finding allowed the patient to be discharged. This method results in 1.0 US and 0.7 CT scans per patient, with a 3.8% negative appendectomy rate and 5.9% missed or delayed diagnosis rate.
- The second strategy was to perform ultrasound on the low-risk group and discharge if findings are negative and operate if findings are positive, perform US then CT (as described above) for the medium-risk group, and perform CT first for the high-risk group. A positive US or CT finding led to an operation, negative US findings led to CT, and negative CT findings allowed discharge. This method results in 0.77 US and 0.66 CT scans per patient (a 16% decrease in imaging use), with minimal change in negative appendectomy rate (4.0%) and missed or delayed diagnosis rate (6.1%).
- The final strategy involved selective imaging: admit and observe the low-risk group without imaging, perform US then CT for the medium-risk group, and perform surgery without imaging for the high-risk group. This selective imaging strategy significantly decreased imaging use by 39%—to 0.62 US and 0.43 CT scans per patient—with a small increase in the negative appendectomy rate to 6.1% and a minimal increase in the missed or delayed diagnosis rate to 6.3%.
Commentary
These authors have previously published data on their use of an imaging algorithm using US followed by CT for equivocal cases, which was highly accurate, with low rates of negative appendectomy or missed appendicitis, at the expense of a very high rate of imaging (1.70 scans per patient). Many would argue that this rate was unnecessarily high. With the use of their clinical prediction rule, the use of imaging was decreased, although patients in the selective imaging category still had 1.05 scans per patient, including 0.43 CT scans per patient, at the cost of a small increase in negative appendectomy rate, primarily from those in the high-risk category going directly to surgery. This selective imaging strategy is likely to be very close to the actual clinical practice of physicians in many EDs: to operate on those patients at high risk, image those patients at intermediate risk, and observe those at low risk. The difference is that a new clinical prediction rule was derived to identify these three risk categories. We must remember that this clinical prediction rule requires validation before general clinical use, and that applied in a setting where the incidence of appendicitis may not be as high (60%), or the ultrasonographers may not have similar expertise, is likely to give very different results.
Clinical scoring systems
Source: Birkhahn RH, et al. Classifying patients suspected of appendicitis with regard to likelihood. Am J Surg 2006;191:497-502.
There are at least 14 different clinical scoring systems developed to enhance the accurate diagnosis of appendicitis, yet few have been validated, none are endorsed by national surgical or emergency medicine organizations, and few have been shown to significantly improve the accuracy of diagnosis or diminish the use of imaging. Do we need another clinical scoring system? Perhaps we do, if it could improve the overall accuracy and diminish use of imaging. Researchers in this study prospectively developed an appendicitis likelihood model using random-partition modeling in 439 patients, 101 (23%) of whom had appendicitis. The aim of the decision rule was to define a low likelihood group who would not require CT or surgery, an intermediate likelihood group who would be imaged with CT, and a high likelihood group who would undergo laparotomy without the associated delay of imaging. The low likelihood group was characterized by WBC less than 9.5 x 10⁹/L and either no right lower quadrant tenderness or a PMN count less than 54%. The high likelihood group had WBC greater than 13 x 109/L with rebound tenderness or both voluntary guarding and PMN count greater than 82%. The low likelihood group categorized 48% of all patients, 1 of which had a delayed appendicitis diagnosis, for a negative predictive value of 99.5%. The intermediate likelihood group contained 40% of all patients, 52 of whom (30%) had appendicitis. The high likelihood group contained 12% of all patients, 47 of whom had appendicitis, for a positive predictive value of 88.7%.
Use of this clinical prediction rule decreased the negative appendectomy rate, the delayed diagnosis rate, and the use of CT imaging when compared to standard clinical practice in this population. The negative appendectomy was 5.6% with the rule versus 14% for standard care, the delayed diagnosis rate was 1% with the rule versus 10% for standard care, and the use of CT imaging was 40% with the rule versus 71% for standard care.
Commentary
Although this was a derivation study of a new clinical prediction rule, and as with all clinical prediction rules requires further validation prior to routine clinical use, this concept of identifying low-, intermediate-, and high-risk groups for observation, imaging, and surgery, respectively, is similar to the study of Garcia Peña and researchers. This study, however, was able to successfully reduce imaging to 40% without compromising (and in fact improving) the negative appendectomy and delayed diagnosis rates. This study was unable to determine the effect of the clinical prediction rule on the rate of rupture, another very important outcome in appendicitis, although we presume it would not increase this rate since the delayed diagnosis rate was decreased.
If validated, this "appendicitis likelihood model" based simply on WBC and physical examination findings has the potential to eliminate as many as 48% of low-risk patients from further testing including CT imaging and identify as many as 12% of patients at high risk for appendicitis who could undergo laparotomy also without CT imaging. Using this model could potentially provide absolute (and relative) reductions in the rate of CT imaging by as much as 31% (44%), in the rate of missed appendicitis of 9% (90%), and in the rate of negative laparotomy of 8% (60%).
Conclusions
When we consider the diagnosis of appendicitis, we begin by trying to estimate the likelihood that the patient has the disease based on clinical findings. The article by Andersson gives us the likelihood ratios (see Table 1) for various historical, physical examination, and simple laboratory findings. As mentioned previously, LRs can be useful for transforming between pretest to post-test probabilities using software or the Fagan nomogram.
|
We are concerned about the risk of perforation, which is known to be greater when the diagnosis is delayed, in children, in the elderly population, and in females. Studies discussed here also suggest that the risk of perforation increases when untreated symptoms persist beyond 36 hours. We should be aware of diagnostic delays in cases of nonclassic presentation, absence of right lower quadrant tenderness, presentations to caregivers outside of the ED, and following the use of CT imaging.
CT imaging has remarkable predictive ability, with especially useful negative likelihood ratios. (See Table 1.) When deciding on which type of abdominal CT to order, it appears that noncontrast CT not only will be faster and more comfortable, but probably just as accurate as contrast studies. When evaluating CT scan results, it is important to remember that although experienced CT radiologists disagree commonly (13% - 30% on various important findings), final diagnostic errors are not very common, although false-positive findings are more likely than false-negative ones. Equivocal readings, though, are not uncommon and still carry a measurable risk of appendicitis, perhaps as high as 30%. Beware of isolated free fluid, fat stranding, fluid-filled appendix, and abnormal enhancement because these are the most commonly listed false-positive and false-negative results. Appendiceal widening is sensitive but very nonspecific, and isolated widening without other changes is likely to be negative. When the appendix is not visualized and there is no evidence of inflammation (i.e., fluid, stranding), incidence of appendicitis varies between 2% and 17%.
Although the use of CT imaging appears to have revolutionized the diagnostic approach to appendicitis, some authors question whether CT use has truly decreased the incidence of negative appendectomy and appendiceal rupture rates, especially in nonresearch institutions. We must balance the risks of negative appendectomy, delayed diagnosis, perforation, and prolonged or complicated hospital course versus the risks of unnecessary CT imaging, with cost, time delay, radiation exposure, and potential cancer risk. In determining how many patients need a CT scan, we know that CT imaging rates of 100% are excessive and that rates less than 50% may be unrealistic and perhaps risky.
We have several options for decreasing routine CT imaging. First, the consultation of an experienced surgeon may be as accurate (Table 1) or perhaps more accurate than imaging.5 Second, the selective imaging strategy described in both the Peña and Birkhahn studies where low-risk patients are observed, intermediate-risk patients undergo CT, and high-risk patients undergo appendectomy, appears to be safe and significantly decreases imaging rates. Both of these clinical prediction rules (which require validation) are based primarily on WBC, PMN, and examination findings. Lastly, we may use the LRs of various clinical and laboratory findings to estimate the post-test probability of appendicitis, discharge those with very low risk (< 1%), observe those with low risk (< 10%), perform CT on those at intermediate risk (10% - 90%), and operate on those with a high risk of appendicitis.
|
References
1. Cardall T, et al. Clinical value of the total white blood cell count and temperature in the evaluation of patients with suspected appendicitis. Acad Emerg Med 2004;11:1021-7.
2. Flum DR, et al. Misdiagnosis of appendicitis and the use of diagnostic imaging. J Am Coll Surg 2005;201:933-939.
3. Terasawa T, et al. Systematic review: computed tomography and ultrasonography to detect acute appendicitis in adults and adolescents. Ann Intern Med 2004;141:537-46.
4. Maluccio MA, et al. A prospective evaluation of the use of emergency department computed tomography for suspected acute appendicitis. Surg Infect (Larchmt), 2001;2(3):205-11.
5. Kosloske AM, et al. The diagnosis of appendicitis in children: Outcomes of a strategy based on pediatric surgical evaluation. Pediatrics 2004;113:29-34
Much has changed recently in the diagnosis of appendicitis, with a dramatic increase in the use of imaging modalities. Over the past decade the use of computerized tomography (CT) has outpaced that of ultrasound (US), and now is used nearly routinely because of its excellent sensitivity and specificity.Subscribe Now for Access
You have reached your article limit for the month. We hope you found our articles both enjoyable and insightful. For information on new subscriptions, product trials, alternative billing arrangements or group and site discounts please call 800-688-2421. We look forward to having you as a long-term member of the Relias Media community.