2001 Salary Survey Results: Job opportunities in home health will grow as seniors age
2001 Salary Survey Results
Job opportunities in home health will grow as seniors age
According to the Department of Labor’s Occupational Outlook Handbook, 2000-01 Edition, the outlook for the home health care field is promising.
In fact, the Department of Labor predicts that employment opportunities within the field will grow by more than 36% between now and 2008, partly because of the projected rise in the number of Americans who are or will be in their 70s and older in the coming years.
Not surprisingly, these people will experience a greater need for health care and accordingly, for home health care services.
Another factor adding to the projected boom within the home care industry is the health care system’s increasing efforts to reduce costs by moving patients from the hospital environment into the home as soon as possible.
Still a third factor contributing to home care’s growth is a high turnover rate — home care is highly demanding and stressful work that is often accompanied by low salary and poor benefits. However, the personal rewards of helping others in many cases outweighs the industry’s low points and many in the field say they cannot imagine leaving it.
Not too long ago, Hospital Home Health sent out a survey, polling our readers on a variety of topics relating to their job duties, agency setup, salary, and position. Now the results of HHH’s 2001 salary survey are in.
If you’ve ever wondered who your fellow readers are, they are overwhelmingly well-educated women in their 40s and older, according to responses we received to the survey.
A little more than half of HHH readers participating in this year’s survey (52.6%) are in their 40s — in fact, only 12.8% are younger (1.3% are between 26 and 30 years old, 2.6% are between the ages of 31 and 35, and 8.9% are between 36 and 40) — while a substantial number of survey participants are in their early 50s (23.1% are between the ages of 51 and 55, while 6.4% are between 56 and 60). Home care professionals age 61 to 65 comprise 2.6% of HHH survey participants.
Slightly more than 83% of our readers who participated are women (83.3%) and of those, the majority have advanced degrees such as BSN (16.7%), MBA (16.7%), MS (8.9%), MSN (15.4%) and MA (3.9%).
Slightly more than 10% (10.3%) hold a Bachelor of Arts degree. The high number of advanced degrees is reflected in the number of survey respondents whose current jobs are either that of vice president or upper management — 41% say they fall into executive positions, while 50% further differentiate their titles as director of home care service or clinical operations, CEO, and director/administrator.
As for your job certifications, 68.3% of HHH readers have certifications other than FAAN, CHE, or RN-C.
Where you work
While it’s no surprise, the bulk of HHH survey participants (69.2%) are employed by hospitals or hospital-affiliated home care agencies while slightly more than a quarter (26.9%) work for independent home care agencies.
Of those who work in other environments, 1.3% work in private practices and 2.6% work in academic settings.
Whether HHH readers work for a hospital-based agency or somewhere else, 78.2% of you work for nonprofit entities, while another 14.1% work in the for-profit arena. Colleges or universities and county government account for 2.6% and 5.1%, respectively.
What’s more, 88.5% of survey participants’ agencies do not charge patients by the hour. That said, 7.8% are evenly divided in charging hourly fees in each of the following categories: less than $30, between $31 and $50, and between $91 and $110. Only 1.3% charge an hourly rate of between $71 and $90 per hour.
While most of our respondents work in a hospital-related setting, most are in hospital-based agencies. A little more than a third (38.5%) say they don’t work in hospitals.
However, those that do work in smaller hospitals of 400 beds or less — the largest percentage (15.4%) say they work in hospitals with between 101 and 200 beds.
Following closely behind are those who work in hospitals with between 301 and 400 beds (12.8%).
Employees of hospitals with between 201 and 300 beds make up another 8.9% of HHH survey participants. A little more than 7% are employed in hospitals with between 401 and 800 beds, while 10.3% work in hospitals with more than 800 beds.
Readers who replied to the salary survey are evenly split according to their agency location both with respect to the country as a whole and within any given region. Roughly 28.2% report their agency is located in an urban area, while 26.9% and 29.5% say their agency is located in a suburban or medium-sized community, respectively. Only 15.3% report that their agencies are located in rural settings.
Midwesterners make up 42.3% of HHH survey participants, while the Northeast and Southeast/ Southwest comprise nearly the remaining half with 24.4% and 26.9% of readership, respectively.
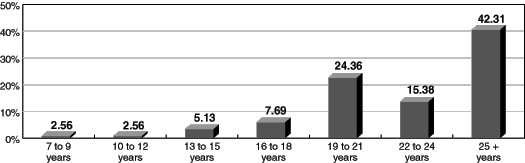
No matter where HHH readers work, the vast majority (42.3%) of those participating in our survey have worked in the health care field for more than 25 years, (see chart below) while almost as many (39.7%) have worked in the field for between 19 and 24 years.
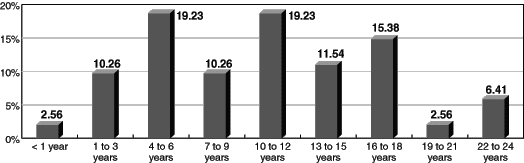
Close to one-fifth of survey respondents (19.2%) have worked in their current position or in jobs with similar responsibilities for between four and six years or between 10 and 12 years, respectively, while another 15.4% have worked in their current jobs for between 16 and 18 years. (See chart below) Close to 7% of readers have held similar positions for more than 22 years.
Despite the Department of Labor’s position on high turnover, HHH readers are committed to not only their jobs but the profession as a whole.
How Long Have You Worked in the Health Care Field?
How Long Have Your Worked in Your Current or Similar Positions?
The benefits of home health care
According to survey responses, the HHH readership may be atypical in that the average salaries are relatively high, depending, of course, on where you live. Whether it reflects an increase in salaries or fewer people at the lower levels of the home care profession, 15.4% of readers are earning salaries between $50,000 and $59,999, compared with 20.5% in 2000.
Perhaps almost as interesting in the number of those earning salaries that are substantially higher — some 25.6% said their annual salaries were between $60,000 and $69,000, while another 23.1% said they earned between $70,000 and $74,999 (10.3% last year reported earning in this category).
As for the rest of our readers, the pay scales range from $30,000 to $39,000 (2.56%) on the low end to more than $130,000 (5.13%) on the uppermost reaches of the scale. In this year’s survey, no respondent reported a drop in income.
In fact, 46.2% said their income had risen by between 1% and 3%, while another 28.2% said their earnings were up by between 4% and 6%. Slightly more than 5% (5.12%) said their salaries had risen by 16% or more over the past year.
This is compared to a 2000-2001 survey from the Department of Labor, which showed that the median hourly earnings of home health and personal care aides were $7.58 in 1998.
The middle 50% earned between $6.41 and $8.81 an hour, while the lowest 10% earned less than $5.73 and the highest 10% earned more than $10.51 an hour. Median hourly earnings in the industries employing the largest number of home health aides in 1997 were as follows: home health care services earned $8, hospitals paid $7.90, personnel supply services paid $7.70, and residential care programs and individual and family services paid $7.20.
Benefits, too, play a large part in job satisfaction, with the most survey respondents ranking a variety of benefits from medical (78.2%) and dental coverage (30.7%) to life insurance (44.9%) and having a flexible work schedule (57.7%) as being extremely important.
Also ranking as extremely important to HHH survey respondents were 401K plans or similar retirement programs (70.5% and 74.4%, respectively), and the chance for annual and semi-annual bonuses (43.6%). Nearly 40% of readers (39.7%) said that there was no opportunity for bonuses at their current place of employment.
Home health still has along way to go in some of the newer benefits that a growing percentage of American workers are seeing. Nearly three-quarters of respondents (74.3%) said their agency or company did not offer elder care, 41% said there were no exercise facilities available to them though the workplace, 58.9% said they did not receive child-care services through work, 69.2% reported no chance at profit-sharing, and 15.4% said that maternal/paternal leave was not counted as an employee benefit.
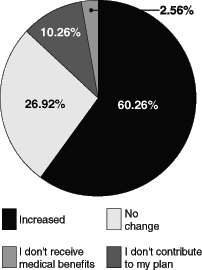
And in a trend that has apparently left not even the health care profession untouched, home health care employees are paying more this year than in year’s past for health care coverage. Of those responding, 60.3% of readers said their contributions have increased while 26.9% reported no change. (See chart below)
Of course, high salaries come with a cost. Interestingly, when compared to last year, while the average number of readers who reported working between 46 and 50 hours in a given week rose (43.6% in 2001 compared to 27.3% in 2000), there was enough of a shift when compared to last year to indicate that at least some are working fewer hours than they did at this time last year.
In 2000, a third (33.3%) worked between 41 and 45 hours each week; that number is down to 24.4% in 2001. Similarly, in 2000, 18.2% of you were working between 51 and 55 hours each week. This year, the number of respondents reporting a similar time commitment dropped to 11.5%. As for those working even more, the trend ended. This year, 12.8% said they are working between 56 and 60 hours in any given week, compared with 9% at this time last year.
Perhaps part of the drop in hours worked can be attributed to an increase in the number of agency employees. Of those responding, 44.8% of readers said their agency staff had increased over the past year, while 17.9% reported no change. This compared to last year, when more than 27% said that their number of co-workers had increased with 15.2% reporting their department or agency has experienced no changes in the number of staff.
When the analysis is said and done, the HHH reader is typically a woman in her 40s or 50s who holds either a BSN, MSN, MBA, or BA degree and has a professional certification to her name. For the most part, she is committed to home care having worked in the field for more than 19 years, typically in the same type of position or at the same level for anywhere from 4 years to 18 years. She works long hours but not as long as she did last year and has seen her salary and the help she receives on the job rise over the past year. Perhaps the government is right after all, and home health care is an industry on the rise.
Has Cost of Contribution to Your Medical Plan Changed?
Subscribe Now for Access
You have reached your article limit for the month. We hope you found our articles both enjoyable and insightful. For information on new subscriptions, product trials, alternative billing arrangements or group and site discounts please call 800-688-2421. We look forward to having you as a long-term member of the Relias Media community.