The Clue in Lead II
By Ken Grauer, MD
Professor Emeritus in Family Medicine, College of Medicine, University of Florida
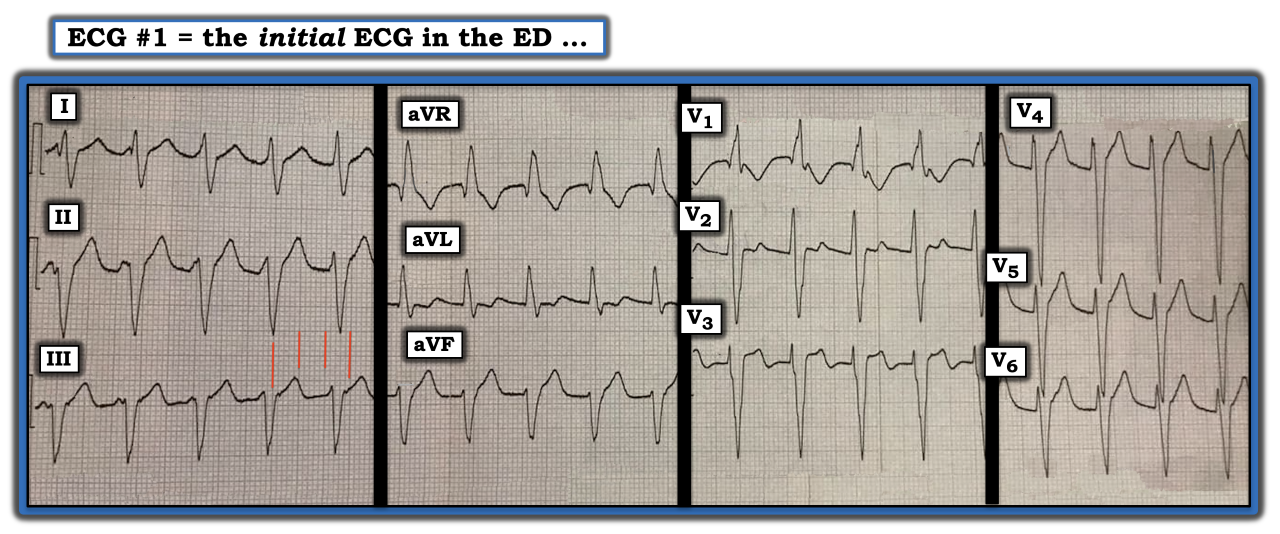
How should one interpret the ECG in the figure below? The figure was obtained from a 40-year-old man who was hemodynamically stable at the time this tracing was recorded. The key clue is in lead II.
Unfortunately, clinical information is unavailable on this patient. That said, my systematic approach for assessing the rhythm in this tracing remains the same. I favor the Ps, Qs, 3R approach.
Ideally, a simultaneously recorded long lead rhythm strip would accompany this 12-lead tracing. Still, we can gain an overall idea of the regularity of this rhythm by surveying successive beats in each of the four groups of three simultaneously recorded leads.
The rhythm appears regular. The rate of the rhythm is ~115 beats per minute (For clarity, since ECG grid lines are not seen well, I have added four vertical red lines to indicate the size of large boxes on this ECG paper). Since the R-R interval measures between two and three large boxes (and closer to three large boxes), I estimate the ventricular rate at ~115 beats per minute.
Obviously, the QRS is wide — clearly more than half a large box in duration — and probably at least 0.12 seconds. Normal sinus P waves are absent (i.e., there is no regularly occurring upright P wave with fixed PR interval in lead II — and no clear evidence of atrial activity in other leads). This rhythm is a regular wide complex tachycardia (WCT) at ~115 beats per minute without a clear sign of sinus P waves. Statistically, the overwhelming majority of such rhythms will turn out to be ventricular tachycardia (VT).
Further, VT is suspected because QRS morphology in the figure does not resemble any known form of conduction defect. Finally, as per the title of this ECG Review — did you see the clue in lead II?
Note how the shape of the first part of the QRS complex in lead II continually changes. This is because an upright P wave that is totally dissociated from (and unrelated to) its neighboring QRS complexes is present at different (changing) points in the cardiac cycle. This finding of AV dissociation in a regular WCT rhythm is diagnostic of VT.
The rate of the VT rhythm in this case is slower than is usually seen. This raises the question as to whether this rhythm might represent a “reperfusion” rhythm in a patient with recent infarction. The answer to this question will depend on those clinical circumstances of this case that were not revealed.
For more information about and further discussion of this case, please visit here.
How should one interpret the ECG in the figure? The figure was obtained from a 40-year-old man who was hemodynamically stable at the time this tracing was recorded. The key clue is in lead II.
Subscribe Now for Access
You have reached your article limit for the month. We hope you found our articles both enjoyable and insightful. For information on new subscriptions, product trials, alternative billing arrangements or group and site discounts please call 800-688-2421. We look forward to having you as a long-term member of the Relias Media community.